
Nelson Saiers: On His "Inside Wall Street" Exhibition (2016)
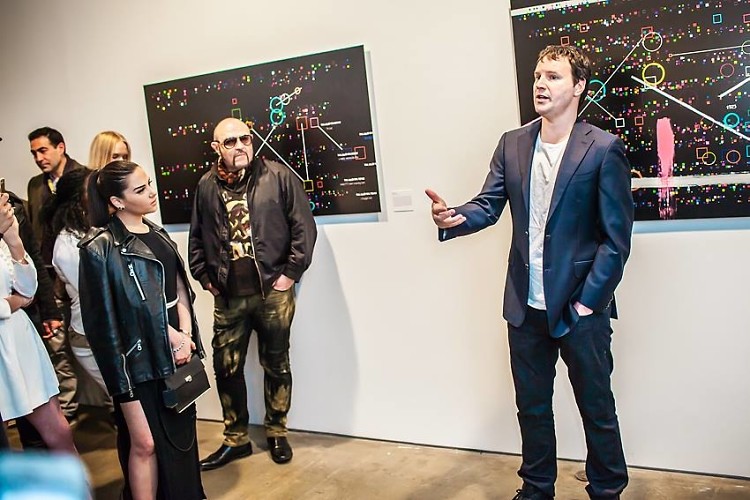
Nelson Saiers: I think one of the interesting aspects of the art in my show "Inside Wall Street" are the background shapes. Are the shapes that make up the background of many of the pieces. These colorful shapes—that are triangles, circles, and squares—that appear to be random are actually not random. In order to really help convey the complexity and the intricacies of managing a derivative portfolio, I thought it'd be interesting to actually take snippets of the algorithm that helped run my hedge fund and transform that into this visual imagery.
Now, real quick—what is an algorithm? An algorithm, in my case, was a propriety program written by, created by, me and my team that would help risk-manage the hedge fund, and also would scour thousands of derivatives globally, and try to find the best investment opportunities available. And so....Now, obviously this C# or this programmatic code. How do you transform that into this visual imagery? So I created a process, embedded in that process, I wanted to help convey some of the causes of 2008. So the process to transform this programmatic code into this visual imagery incorporated Braille and mathematics.
Now, why Braille? Turns out, one of the main reasons 2008 happened was blindness by everybody—from investors to rating agencies to government regulators. Blindness to modern finance and the products they were kind of overseeing. And also short-sightedness. So to convey the short-sightedness and blindness, I used Braille. Now, turns out, one of the things that caused this blindness was the use of mathematics with some of these complex products that were being created. So to convey these effects on 2008, I used Braille and mathematics to transform this C# code, or this programmatic code, into this imagery.
[Photo courtesy of HG Contemporary]

.jpg "How Comms Guru & Founder Of The PR Net Lisa Smith Put Her Stylish Stamp On The Industry")
.jpg "Who Are The Assoulines? Meet The Chic First Family Of Luxury Publishing")

